What is the Altman Z-Score?
The Altman Z-Score, designed by NYU Professor Edward Altman, is a model used to predict the near-term likelihood of companies falling into bankruptcy or insolvency.

The Altman Z-Score, designed by NYU Professor Edward Altman, is a model used to predict the near-term likelihood of companies falling into bankruptcy or insolvency.
Originally developed to evaluate the probability of bankruptcy within the manufacturing industry, the Altman z-score utilizes a weighting system of various financial ratios that each measure a specific financial attribute.
The purpose of the z-score model is to measure a company’s financial health and quantify the probability of the company filing for bankruptcy or needing restructuring in the near future, i.e. within two years.
Often used as part of credit analysis – i.e. by lenders or distressed investors protecting their downside risk – the combined financial ratios analyze the company’s core operational strength, liquidity position, solvency, profit margins, and leverage and combine them into an overall score.
The five components of the z-score calculation are described below.
As a side note, it is recommended for the "Total Assets" metric to exclude any intangible assets.
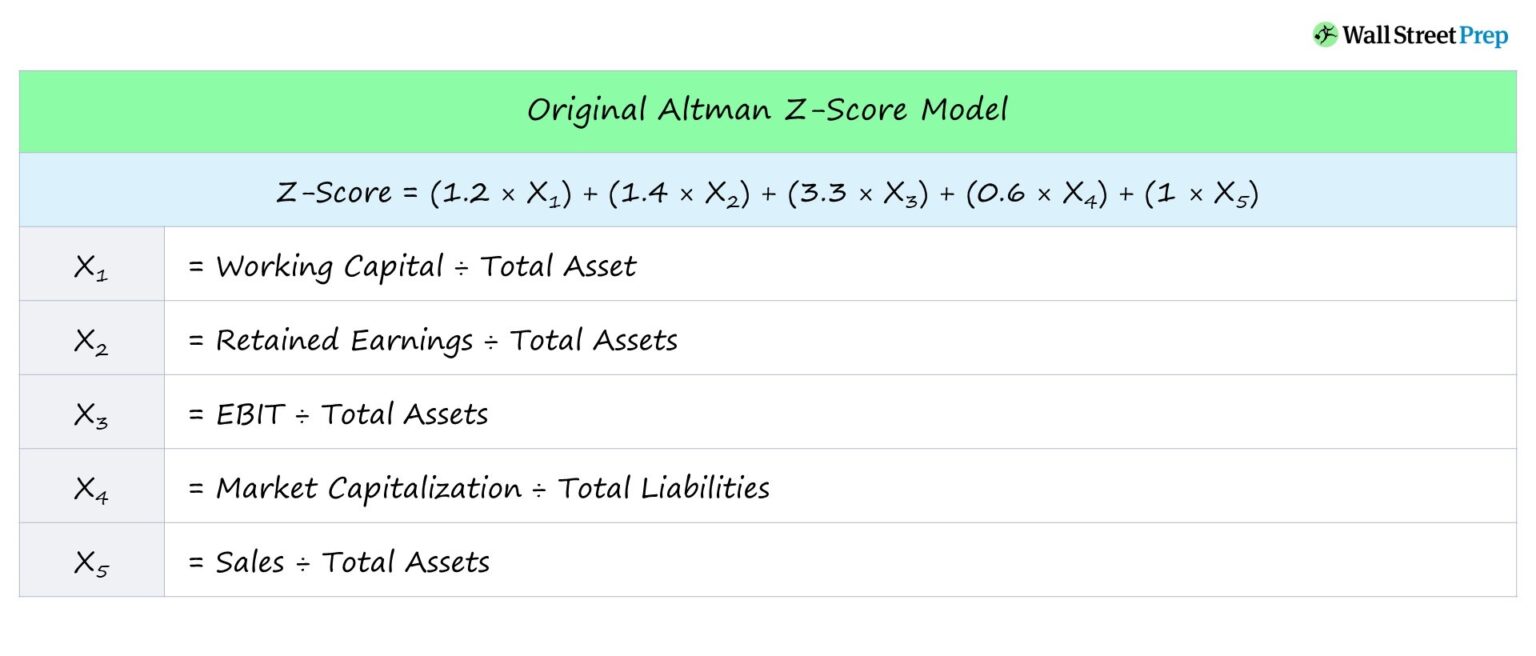
Putting together the prior section, the equation for calculating the z-score multiplies each ratio by a weighted metric, and the sum represents the z-score of the company.
The original z-score formula intended for public manufacturing companies is shown below:
The formula above is the most common variation of the Altman z-score, although each model consists of different variables and weighing systems that affect the score.
As such, it is crucial to pick the most suitable model for the company being analyzed (and also to understand the limitations of the model).
For reference, below are the formulas for some of the other more common model variations:
The Altman z-score quantifies the financial stability of a company to predict how likely a company will become insolvent.
Typically, a lower Z score value indicates a higher risk of bankruptcy and vice visa.
While a high z-score does not necessarily imply sound financial health and long-term viability, a low z-score is a potential red flag suggesting the need to pry deeper into a company’s fundamentals.
For public manufacturing companies, the following rules serve as general benchmarks:
| Z-Score | Interpretation |
|---|---|
| > 2.99 | Safe Zone – Low Likelihood of Bankruptcy |
| 1.81 to 2.99 | Grey Zone – Moderate Risk of Bankruptcy |
| < 1.81 | Distress Zone – High Likelihood of Bankruptcy |
For private non-manufacturing companies, the benchmarks are as follows:
| Z-Score | Interpretation |
|---|---|
| > 2.60 | Safe Zone – Low Likelihood of Bankruptcy |
| 1.10 to 2.6 | Grey Zone – Moderate Risk of Bankruptcy |
| < 1.10 | Distress Zone – High Likelihood of Bankruptcy |
One of the main drawbacks of the z-score model is how abnormalities – that are not necessarily negative indicators of a company’s financial state – can result in a lower z-score.
For instance, companies operating in the restaurant industry often exhibit a negative working capital cycle, i.e. in such cases, negative working capital could signify strong cash flow management, not potential insolvency.
Additionally, early-stage companies that are growing rapidly yet are unprofitable are not suited for the model.
Therefore, the z-score model – as is the case with all models and theories – must only be relied upon once deemed appropriate to the situation and serve as a single tool among many to evaluate a company’s likelihood of potential bankruptcy.
We’ll now move to a modeling exercise, which you can access by filling out the form below.


Suppose a public manufacturing company is at risk of insolvency following several periods of underperformance, particularly in terms of profitability.
Using the original z-score model, we’ll estimate the chance of bankruptcy of our hypothetical company.
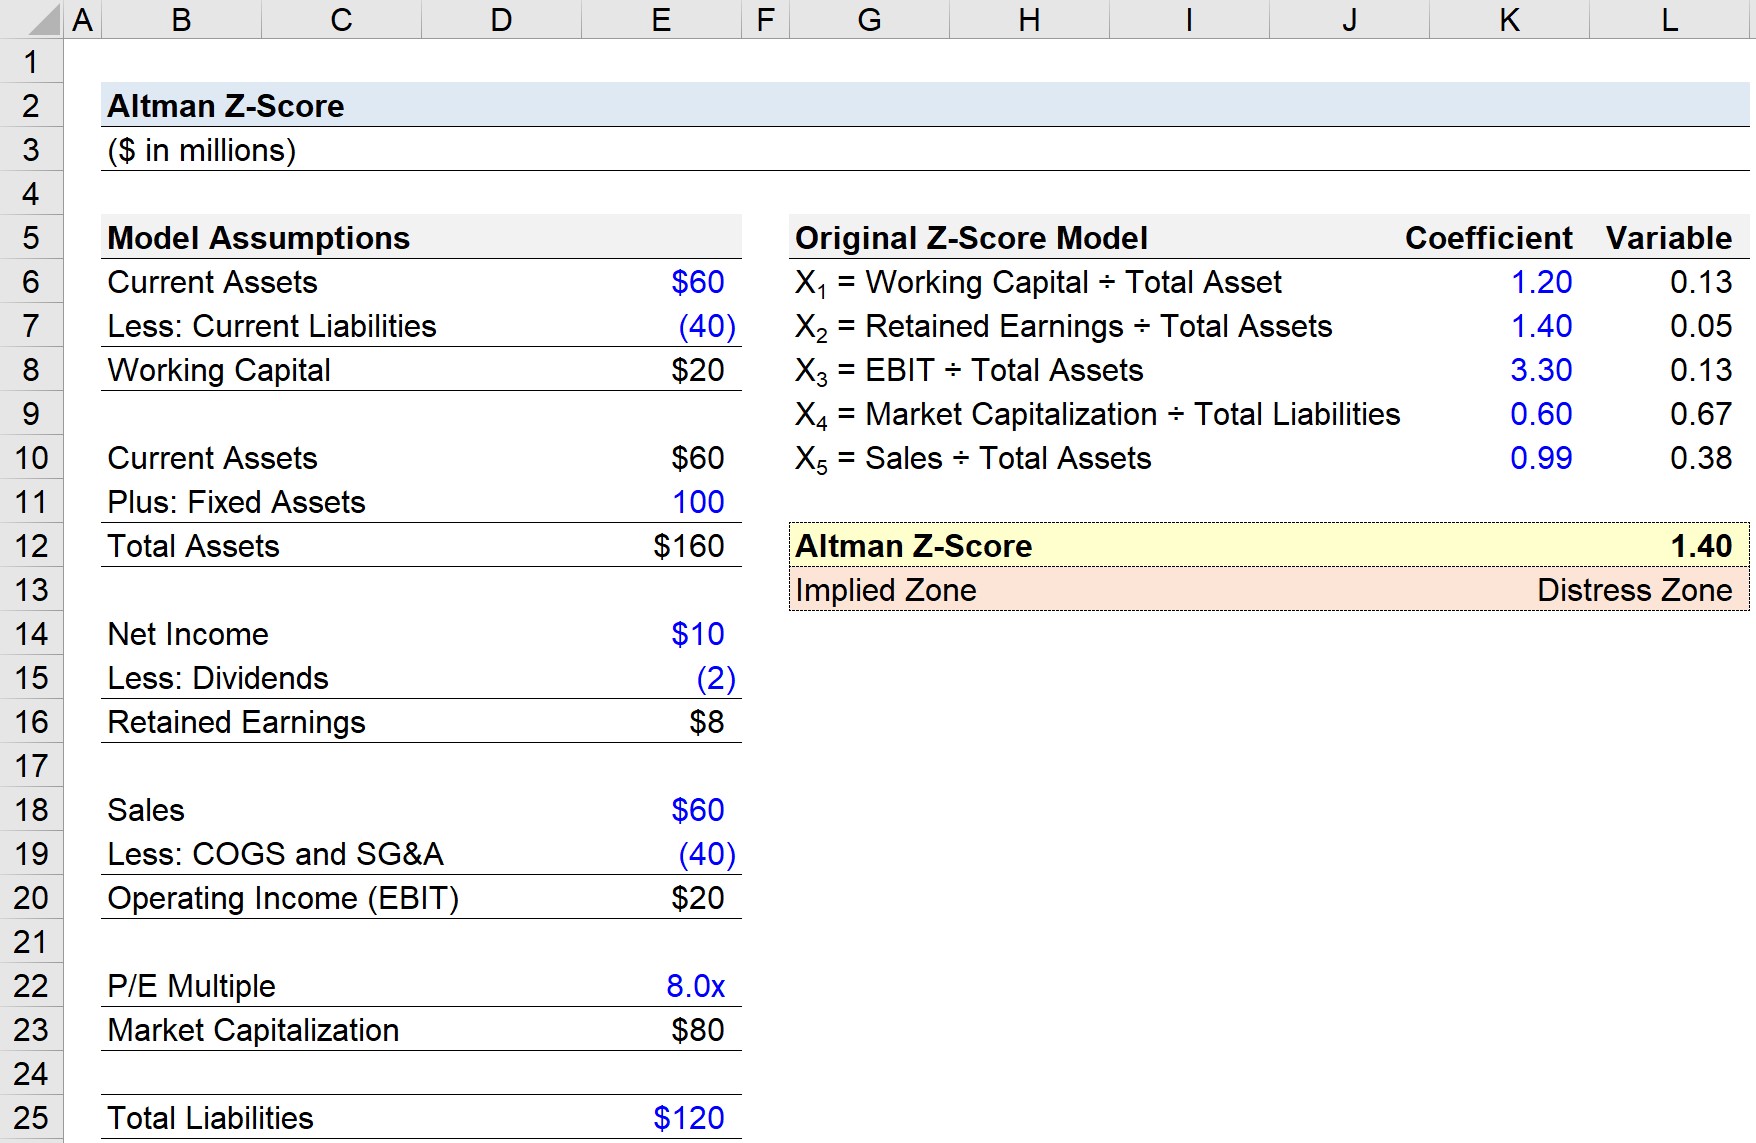
The following assumptions will be used for our modeling exercise.
Given those initial assumptions, our next step is calculating the remaining inputs.
We can observe that the excess current assets barely cover the current liabilities.
As a manufacturing company, the company’s operations rely on significant purchases of fixed assets (PP&E) – i.e. capital expenditures – as confirmed by the $100 million in fixed assets.
Moreover, the company’s net margin is approximately 17%, with a dividend payout ratio of 20%. If necessary, those dividend issuances would need to be halted soon.
While the operating margin and net margin are not necessarily poor, especially for the manufacturing sector, the more concerning red flag is the low P/E multiple (and market capitalization) – which suggests the market is not optimistic about the company’s future growth and profitability.
Considering the low net income, the P/E multiple here could be misleading high, so the 8.0x – despite being a normal valuation multiple in most industries – should be perceived negatively.
The inputs for our z-score calculation are the following:
We then plug the inputs into our z-score formula:
Since the z-score of 1.40 is below 1.81, our company is in the "Distress Zone," where the risk of near-term insolvency is high.


Gain a practical foundation in one of the most complex and misunderstood investment disciplines. In collaboration with Wall Street Prep.




No comments yet.